Why Track Your Money?
You probably have a rough idea of what you earn. But do you actually know what you keep?
Most sole operators run their business finances the same way: invoices go out, money comes in, and at the end of the year there's a shoebox of receipts handed to an accountant who tells you what you owe. Everything in between is a bit of a mystery.
The problem isn't that you don't care — it's that tracking money has always felt like admin for its own sake. Numbers in a spreadsheet that don't actually help you decide anything.
VerbalIt Insights exists to change that. It's not accounting software. It's a dashboard that answers the questions you actually have: Am I making good money? Am I charging enough? How much tax am I up for? What do I actually take home? Which clients are actually worth my time?
Insights is split into six tabs. Each one covers a different angle of your business finances. The answers live in data you're already entering — jobs, invoices, expenses. Insights just makes sense of it. The real goal isn't just tracking — it's getting to a point where your income is predictable, not a lucky dip. We'll show you how at the end.
The One Thing That Makes This Work
Before we dive into the tabs, here's the setup that makes everything below useful.
There are three kinds of money your business spends. Most tradies only think about one of them.
Overhead expenses are the regular costs of running — insurance, fuel, phone, tools under a certain value, subscriptions. You manage these in 💰 Finances (tap the icon in your header bar), and they feed directly into your break-even rate, the Overview Money Flow bar, and the Profitability tab's cost breakdown.
Assets are the bigger things your business owns: a van, a trailer, a compressor, a laser level. These aren't expenses in the usual sense — you don't write them off the year you buy them. Instead, they wear out over time. That wearing-out has a value, and it's called depreciation.
Depreciation is often the concept that makes tradies' eyes glaze over. Here's the plain version: your van isn't worth the same in five years as it is today. That lost value is a real cost of doing business — even though no money actually leaves your account.
VerbalIt calculates depreciation automatically using ATO methods (Prime Cost or Diminishing Value), so it shows up correctly in your reports and rate calculations.
Log your business assets in 💰 Finances → Assets. Set the purchase price, the date, and the useful life. VerbalIt handles the rest — depreciation flows through to Insights automatically. Your break-even rate and Profitability tab will both benefit.
Am I Actually Making Money?
The first thing you see when you open Insights. A snapshot of where your business stands right now.
The Overview tab gives you the numbers that matter most at a glance. Use the period toggle (Weekly / Fortnightly / Monthly) at the top to set the timeframe — everything on this tab updates to match.
Cash Position is your running total: what's been paid in, what you've spent, and what you've set aside for tax. It's calculated on a cash basis — meaning only money that's actually hit your account counts. Unpaid invoices don't make you richer. Cash does.
Money Flow is a visual bar that slices every dollar you earn into four segments: business expenses, loan and finance repayments, tax, and your actual take-home. What you're looking for is whether the take-home slice looks healthy.
If expenses are eating 40% of your revenue, that bar will show you — faster than any spreadsheet ever would.
Burn Rate is your break-even hourly rate — the minimum you need to charge per billable hour just to cover your running costs before you take home a single dollar. If your actual rate is below your burn rate, you're losing money on every hour you work. VerbalIt calculates this automatically from your expenses, depreciation, and average billable hours.
Goals & Rate is collapsed by default — tap to expand it. Set your weekly take-home target and VerbalIt works backwards to tell you exactly what hourly rate you need to hit it, factoring in expenses, tax, and your billable hours.
The sync works in both directions: change the take-home goal and the rate updates; change the rate and the hours needed updates. It's the most important tool in here for pricing your work properly.
Advice card sits at the bottom of the Overview and surfaces the most actionable insight right now — whether that's "your burn rate is higher than your current rate" or "you haven't logged any expenses yet." Context-aware, updated as your data changes.
New to VerbalIt? If you have fewer than three paid invoices, the Overview shows a Welcome card instead — a short progress checklist to help you get the most out of Insights as you get started.
Now let's zoom out and see how you're tracking over time →How Am I Tracking Over Time?
Numbers today are useful. Numbers over time are powerful. The Trends tab is where you see whether your business is actually improving.
The Trends tab shows your financial performance as a chart, plotted across time. Use the internal toggle (Weekly / Monthly / Yearly) to zoom in or out — this is separate from the period toggle on Overview, so you can look at weekly patterns without affecting anything else.
Each period in the chart breaks down:
- Revenue — total invoiced and paid in that period
- Take-home — what you actually kept after expenses and tax
- Materials — job materials and COGS costs
- Expenses — overhead and running costs
- Liabilities — loan repayments and finance costs
- Tax — estimated income tax for the period
Use the navigation arrows to move backwards through history. Quiet spell six months ago? Scroll back and see exactly what was happening — was it low revenue, or high costs eating into an otherwise decent month?
This tab doesn't tell you what to do. It tells you what happened. That's often enough — once you can see the pattern, the action usually becomes obvious.
You know the numbers. But who's actually paying? →Who's Actually Making Me Money?
Not all clients are created equal. Some pay well, pay fast, and keep coming back. Others… don't. Time to find out which is which.
The Clients tab shows a revenue breakdown by client, all-time. They're ranked by total revenue — biggest contributors at the top. For each client you can see:
- Total revenue — all paid invoices from that client, ever
- Repeat rate — how often they come back vs. one-off jobs
- Average days to payment — how long they take to actually pay
Tap any client to expand their full breakdown: paid vs. outstanding amounts, first invoice date, last invoice date.
You can tell at a glance whether a client who seems big is actually dragging out payments — or whether someone you think of as a small account is actually more reliable than most.
The average days to payment metric is underrated. A client who invoices $20,000 a year but takes 65 days to pay is costing you money in cash flow stress. A client who invoices $12,000 but pays in 8 days is worth more to your business than the number suggests.
The Clients tab lets you see this properly. Use it when you're deciding who to prioritise, who to chase for overdue invoices, or whether your client base is actually as stable as it feels.
Now let's see what work is in your pipeline →What's Coming In?
Cash in the bank is history. Your pipeline is your future. This tab shows you what's coming — and whether it's healthy.
The Pipeline tab tracks where your work sits right now across three stages:
- Quoted — jobs you've sent quotes for, waiting on approval
- In Progress — jobs underway, not yet invoiced
- Awaiting Payment — invoices sent, money not yet received
Each stage shows the total value of work sitting there. The shape of your pipeline tells a story.
A fat "Awaiting Payment" bucket means cash is coming but tied up in outstanding invoices — time to follow up. A fat "Quoted" bucket with a thin "In Progress" means approvals are slow — worth a phone call. An empty pipeline across the board is a signal to start chasing new work now, not next month.
Quote conversion rate is the percentage of quotes that turn into paid work. If you're quoting 10 jobs and only 2 are converting, something's off — price, timing, follow-up, or just the wrong type of jobs. If you're converting 8 out of 10, you're probably underpricing. The sweet spot for most trades is somewhere in the middle.
If you use the Enquiry Confidence tool, the Pipeline tab also shows your full enquiry-to-revenue funnel: how many enquiries came in, how many became quotes, how many quotes became jobs. That's your whole sales process in one view.
Health warnings appear automatically when something looks off:
- Slow approvals — quotes sitting unanswered for more than a week or two
- Low conversion rate — lots of quoting, not much winning
- Large unpaid bucket — significant revenue sitting in outstanding invoices
Which Work Is Worth Doing?
Revenue tells you how busy you are. Profitability tells you whether being that busy is actually worth it.
The Profitability tab breaks down two things: where your money goes, and which types of work are actually making you money.
Where You Spend is a stacked bar showing your cost breakdown by category — pulled from your recurring overhead expenses and any spend you've logged on jobs. You can see at a glance whether fuel, insurance, materials, subcontractors, or equipment are your biggest cost drivers.
When you know where the money goes, you can make decisions about it. When you don't, you just wonder why the margin feels thin.
Profit by Job Type compares revenue versus costs per service type, all-time. If you do plumbing, electrical, and fit-out work, you can see which category actually makes money after costs — not just which one brings in the most revenue. These can be very different answers.
If you haven't logged any cost data yet, the Profitability tab will show a health indicator prompting you to add expenses and overhead. The charts are only as good as the data behind them — so the more you put in, the more you get out.
Ready for the formal stuff? →The Formal Stuff
You probably don't think you need a Balance Sheet. Most tradies don't — until they suddenly do.
Applying for a business loan. Claiming on insurance after a van gets written off. Selling the business when you're ready to retire. All of these moments require formal financial documents.
If you've never maintained them, you're scrambling to reconstruct years of data at exactly the wrong time.
VerbalIt generates three standard reports from data you've already entered:
- Profit & Loss (P&L) — revenue, expenses, and net profit for any period you choose
- Balance Sheet — what your business owns (assets) versus what it owes (liabilities)
- Cash Flow Statement — money actually received versus money actually paid out, by period
These are PDF exports. You don't need to do anything special — just keep using VerbalIt and the data builds up over time. When someone asks for your financials, you're two taps away instead of three frantic weeks away.
Depreciation scheme — toggle between General Pool (standard ATO diminishing value) and Simplified Depreciation (the instant asset write-off rules for small businesses). If you're not sure which to use, ask your accountant — but having the choice means your reports match your actual tax treatment rather than a generic assumption.
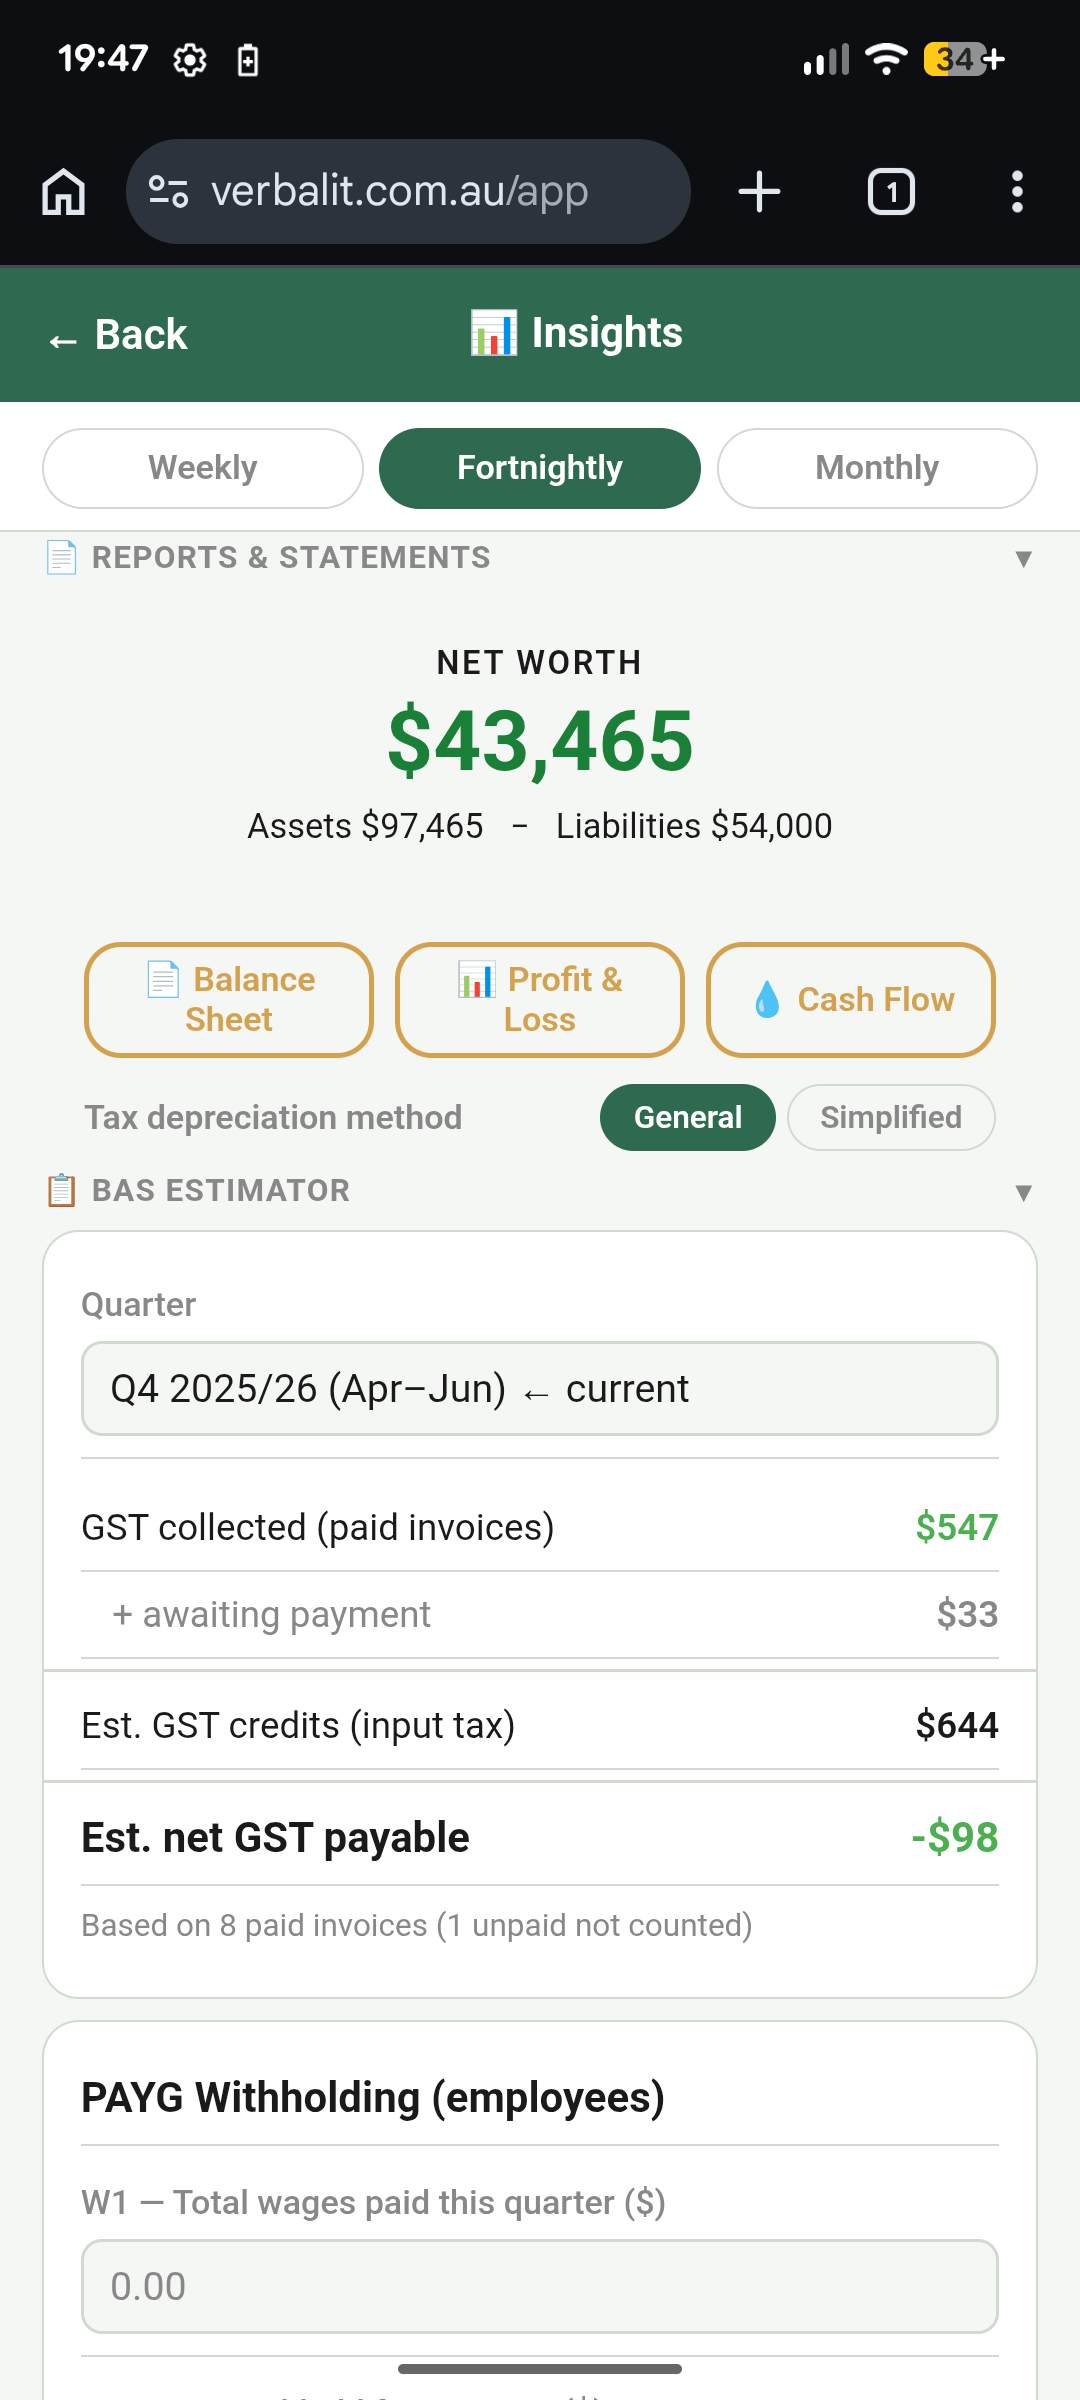
BAS Estimator is also on this tab — it's all about GST. It shows:
- GST collected from paid invoices (what you owe the ATO)
- GST credits from business expenses (what you've already paid in GST on your costs)
- GST credits from materials and COGS purchases
- Net GST owing — the actual number you're writing a cheque for
- PAYG withholding fields (W1 and W2) if you have employees — leave blank if you don't
A word of honesty: these reports don't replace your accountant. They're not audited financial statements. But they give your accountant a massive head start — which means less time reconstructing your year and less of your money spent on their hourly rate doing it.
And here's why all of this matters →The Real Goal: Predictable Income
Here's the thing nobody talks about at the trade counter: the most financially stable sole operators aren't necessarily the busiest. They're the ones with predictable income.
When every dollar depends on finding the next job, your business finances are a rollercoaster. Feast in March. Quiet in July. Scramble in December. Most tradies accept this as just how it works. It doesn't have to be.
The move — and it's simpler than it sounds — is to build even a small base of recurring work. Service agreements with property managers. Monthly maintenance contracts with a few commercial clients. Annual checks for a dozen homeowners. Whatever fits your trade.
You don't need many. Even two or three reliable clients who pay you $800/month each gives you $2,400 that arrives regardless of what the rest of the month looks like. That changes how you sleep. It changes how you quote new work — less desperation, more confidence.
In VerbalIt, your Clients tab and job history show you which customers come back. If the same names keep appearing with a high repeat rate, you're already building a base.
If every month is new faces and one-off jobs, that's your signal to start actively cultivating a couple of repeat relationships. The goal isn't to never do one-off work — it's to not depend on it entirely.
Predictable income is the thing that lets you plan: take on an apprentice, invest in better tools, take a week off without the anxiety. It's not glamorous advice, but it's the closest thing sole operators have to a genuine financial strategy.